In 2024, five companies sold more than 65% of the groceries purchased in Canada. Loblaw, Sobeys, Metro, Walmart, and Costco. When the Competition Bureau studied the market in 2023, it found that 49% of Canadians shop at a store Loblaw operates. In 2022, the three largest chains reported more than $100 billion in combined revenue and earned more than $3.6 billion in profit.1
The belief is that grocery prices reflect supply and demand. Wheat costs more, bread costs more. Fuel prices climb, shipping follows. The number on the shelf is the output of a market.
Between 2001 and 2015, the price of bread in Canada rose 96%. The price of food bought in stores rose 45%.2 The difference was not wheat.
Loblaw, Sobeys, Metro, Walmart, Costco
The rest of the market
In 1986, Canada had eight major grocery chains. By 2023, five remained. Approximately 6,900 independent grocers still operate across the country, but their combined share has been shrinking for decades. The Competition Bureau's conclusion was direct: "Industry concentration has increased, and it has become more difficult than ever for businesses to enter, expand, and compete effectively."1
The structure
In 2007, economist Paul Ellickson studied every supermarket in the United States. His finding, published in the RAND Journal of Economics: grocery markets are a natural oligopoly. Regardless of how large a market grows, between four and six firms capture the majority of sales. The number of dominant firms does not increase with market size. Only the fringe of smaller stores expands.3
The mechanism is infrastructure, not conspiracy. Modern grocery requires warehouse networks, logistics software, cold chain systems, and distribution capacity that cost hundreds of millions to build. These investments create what economists call endogenous sunk costs. They are the price of competing at scale. And they guarantee that only a handful of firms can pay it.3
Ellickson confirmed this across 51 distinct geographic markets. When one firm invested in distribution capacity, rivals responded with matching investments. The result is an arms race that only four to six participants can sustain. That is how grocery markets are built.3
Canada is not an outlier. It is closer to the middle of the table.
| Country | Dominant firms | Combined share |
|---|---|---|
| Norway | 3 | 96.6% |
| Finland | 3 | ~88% |
| New Zealand | 2 | ~86% |
| Germany | 4 | ~75% |
| Australia | 2 | ~67% |
| Canada | 5 | ~65% |
| United Kingdom | 4 | ~64% |
| United States | 4 | ~44% |
Norway's three grocery chains were fined the equivalent of $450 million USD in 2024 for sharing pricing information with one another.4 In Finland, economist Ville Aalto-Setala found that larger grocery retailers carried higher markups but demonstrated no cost efficiencies that justified them. The bigger the firm, the higher the price. Scale did not lower costs enough to explain it. The structure removed the pressure to pass savings through.5
The structure produces the oligopoly. The question is what the oligopoly produces.
The convention
In March 2015, Loblaw and its parent company George Weston Ltd. disclosed to the Competition Bureau that their baking operations had been coordinating wholesale bread prices with Canada Bread since at least 2001. They told the public in December 2017. The arrangement had a name. Participants called it the 7/10 convention.6
A seven-cent increase at wholesale. A ten-cent increase at retail. The retailer kept the three-cent spread. This happened roughly twice a year, for fourteen years, across products sold at every major grocery chain in the country. Bread, bagels, English muffins, tortillas.6
In 2024, economists Robert Clark, Igal Horstmann, and Jean-Francois Houde published their analysis in the American Economic Review. Using national CPI data and store-level prices across six product categories, they isolated the cartel's effect. Their finding: the arrangement increased bread price inflation by approximately 50%.2
Retail increase per round: $0.10
Frequency: ~2 rounds per year
Duration: 14 years (2001–2015)
Bread CPI increase: +96% (all other food: +45%)
Estimated consumer overpayment: $4.3–4.9 billion
Settlement: $500 million
Per Canadian: ~$13
Canada Bread pleaded guilty in June 2023 and paid a $50 million fine, the highest price-fixing fine ever imposed by a Canadian court. Loblaw and George Weston paid nothing in criminal proceedings. They received full immunity for disclosing the scheme. The civil settlement of $500 million, spread across 38 million Canadians and fourteen years of inflated prices, works out to roughly $13 per person.7
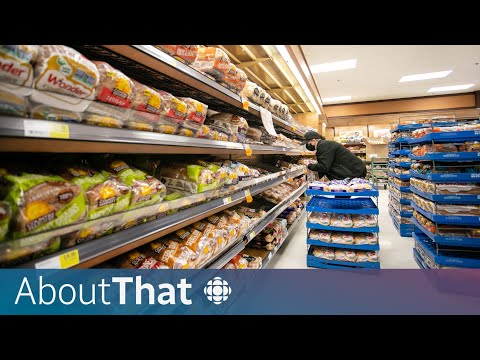
Breaking down the Canada Bread price-fixing scandal | About That
CBC News
In January 2018, Loblaw offered affected customers a $25 gift card. Approximately 3.8 million Canadians registered. The program cost Loblaw roughly $96 million. The cards were redeemable only at Loblaw-operated stores.8
At least seven companies were investigated. As of March 2026, only Canada Bread has been convicted.7
The signal
In March 2020, as COVID lockdowns began, Loblaw, Metro, and Sobeys each introduced a pay premium of about $2 an hour for frontline grocery workers, backdated to March 8. Loblaw's first-quarter revenue rose 10.7% that year, an increase of $1.14 billion. Net earnings rose 21.2%.9
On June 11, 2020, Loblaw announced the premium would end that weekend. On June 12, Metro confirmed. On June 12, Sobeys confirmed. All three companies ended the $2 premium on the same date: Saturday, June 13, 2020.10
Loblaw's president had sent what was later described as a "courtesy email" to competitors before the announcement. Metro's CEO had called competing chain executives seeking information about their timelines. All three companies acknowledged pre-cancellation contact. All three denied formal coordination.11
The Competition Commissioner declined to investigate. Wage-fixing was not criminal under the Competition Act at that time. Two years later, Parliament amended the Act to make it criminal. The amendment was a direct legislative response.11
The bread cartel required fourteen years of coordinated phone calls. The hero pay cut required one weekend and a shared incentive structure. Economists David Byrne and Nicolas de Roos documented how this works. In Perth's gasoline market, they tracked fifteen years of daily station-level prices and found that a single dominant firm used pricing experiments to signal collusive intentions to competitors. Over three years, tacit coordination improved margins by 75%. No contract was signed. No call was made. The market structure was transparent enough that one firm's public pricing decisions functioned as communication.12
In grocery, the prices are on the shelf. The margins are in the quarterly filings. Every competitor can see every move. The signal does not need to be sent privately. It is already public.
The margin
Between 2015 and 2019, Canadian food retailers earned an average of $1.8 billion in net income per year. Their average net margin on food sales was 1.25%. In 2022, net income reached nearly $6 billion. The margin more than doubled, to above 3%.13
Canadian food retail, 2015–2019
More than tripled in three years
The industry's position was that margins remained thin. Three percent is low by the standards of most businesses. But the claim that margins stayed proportional to rising costs was not supported by the data. Jim Stanford of the Centre for Future Work examined industry-wide financial performance using Statistics Canada's tables. His conclusion: "The oft-heard claim that the profit margin on grocery retail has not changed, and that higher profits have simply kept up with the overall rise in costs and prices, is not supported by industry-wide data."13
In the second quarter of 2025, Loblaw reported a retail gross profit margin of 32.02%, the highest the company had recorded in five years.14
Costco's gross margin is 12 to 13 percent. The company has capped its markup at 14 to 15 percent since 1983. Efficiency gains from scale and supplier negotiations flow to lower prices, not higher margins. The membership fee is the profit center. In 2024 and 2025, dunnhumby named Costco the top grocery retailer in Canada.15
Both companies sell groceries to Canadians. One operates at a 32% gross margin. The other at 12%. The difference is a decision about how much to keep, not the cost of running a grocery business.
The squeeze
Eighty-one cents of every dollar Canadians spend on food goes to post-farm gate sectors: processing, packaging, transportation, distribution, and retail. The farmer receives 18.6 cents. In 1997, the farm share was 19.4%. Over twenty-four years, through the largest consolidation in Canadian grocery history, it moved by less than a penny.16
The National Farmers Union submitted data to Parliament in 2023. The retail price of bread had risen 50% over thirty years. Farmgate wheat prices had not matched the increase. Ground beef retail prices had doubled since 1994. The farmgate price for cull cows rose 40% over the same period. The Agricultural Producers Association of Saskatchewan examined seven retail products in 2024 and concluded that "the price increases in retail products cannot be fully explained by the cost of underlying commodities."17
When five companies control the buying side of a market, the dynamic is structural. The retailer sets the wholesale terms. The farmer who refuses faces a market with four remaining buyers.
Private label
Loblaw's No Name brand launched in 1978 with sixteen products. President's Choice followed in the mid-1980s. Today the combined portfolio spans virtually every grocery category. Industry-standard private-label margins run 25 to 35 percent higher than national brand margins.18
A 2004 study published in Marketing Science measured what happens when a retailer introduces its own brand into a category. The retailer benefits in two ways. First, high margins on the store brand itself. Second, higher margins on national brands, because the bargaining position has permanently shifted. The message to the national brand manufacturer is straightforward: accept our terms, or we give your shelf space to our own product.18
The study found that consumers do not obtain lower prices on all national brands after a store brand enters. Only some second-tier brands become cheaper. The premium brands hold their prices. The retailer captures the margin on both sides.18
The retailer sets the price of the national brand. The retailer sets the price of its own brand. The retailer decides the shelf space allocation. One competitor controls the terms of the competition.
Shrinkflation
In 2025, Statistics Canada published a systematic analysis of package downsizing in Canadian grocery. Of eligible products tracked in the consumer price index, 29.6% experienced shrinkflation between 2021 and 2023. Nearly half of all instances occurred in 2022, when grocery inflation reached 9.8%, the highest rate in 41 years. Name-brand products accounted for 77.6% of the downsizing.19
49.5% of instances occurred in 2022
77.6% were name-brand products
A 500g package reduced to 425g
= 18% unit price increase
The price tag stays the same. The product does not.
Multiple studies have confirmed that consumers respond less to changes in package size than to changes in price. A product that shrinks from 500 grams to 425 while holding its sticker price has effectively raised its unit price by 18%. The price tag is what people check. The package is what quietly adjusts.19
The lock
In June 2023, the Competition Bureau found that major grocers use restrictive covenants in commercial leases to prevent competitors from opening stores nearby. When a chain leases space in a shopping center, the lease can prohibit the landlord from renting to another grocer. When the chain leaves, the restriction stays.20
In Dartmouth, Nova Scotia, a Sobeys closed in 2009. A deed restriction filed in 2011 prohibited any grocery store from operating on the property for twenty years. The site sat vacant for more than a decade while nearby residents traveled further for food. In Edmonton, former Safeway locations carry sixty-year restrictive covenants. In Port Elgin, Ontario, a Loblaw-linked covenant creates a three-kilometre radius restriction. In Toronto, a Loblaws covenant prevents grocery leasing within two kilometres.21
In June 2025, Loblaw committed to eliminating all existing restrictive covenants and not entering new ones. The Competition Bureau called it "a key milestone." Sobeys held out longer. In September 2026, its parent company, Empire, signed a consent agreement with the Bureau to stop using and enforcing them.20
The covenants do not raise prices directly. They do something more durable. They prevent the conditions under which prices could fall.
The receipt
Every week, the receipt. Milk, bread, eggs. Prices in a column. The sum at the bottom. The numbers look like facts. They appear to emerge from a process everyone learned in school. Supply, demand, cost, competition. The shelf tag is where the forces converge.
Five companies produce those figures for two-thirds of the country. The structure that guarantees their dominance is not a policy failure or a regulatory gap. It is an economic pattern documented across 51 American markets and visible in every country in the table above. The concentration will not dilute. The coordination does not require a phone call. The margins do not require justification to anyone who cannot shop elsewhere. And the covenants prevent anyone from testing whether lower prices are possible.
This is not a critique of the five companies. Each operates rationally within a structure that economics guarantees will persist. The structure does not need villains. It produces the outcome regardless of who fills the positions. That is what makes it durable. And that is what makes the belief so persistent. Supply and demand are real forces. They operate inside the structure, not the other way around.
The price tag does not lie about the number. It lies about what the number is. It presents a decision as a discovery. An administered outcome as a market result. And the receipt, the most familiar document in the country, records it all without revealing a thing.
Sources
- Competition Bureau Canada, "Canada Needs More Grocery Competition," June 27, 2023. In 2022, Canada's three largest grocers collectively reported more than $100 billion in sales and earned more than $3.6 billion in profits. 49% of Canadians shop at Loblaws-operated stores. USDA Foreign Agricultural Service, Retail Foods Annual, Canada, CA2025-0040, December 30 2025: five major retailers "together account for more than 65 percent of grocery sales." The Exporter Guide Annual, CA2026-0019, July 2026, gives the same figure for 2025. USDA's August 2025 Exporter Guide had put the five at nearly 80 percent for 2024. CFIG: approximately 6,900 independent grocers. MacLaren's, December 2025: eight major chains in 1986, five by 2023. ↩ ↩
- Clark, R., Horstmann, I., and Houde, J.-F., "Hub-and-Spoke Cartels: Theory and Evidence from the Grocery Industry," American Economic Review, 114(3): 783-814, 2024. Collusion increased bread price inflation by approximately 50%. Statistics Canada CPI data: bread, rolls, and buns subcategory rose 96%; food purchased from stores rose approximately 45% over the same period. ↩ ↩
- Ellickson, P.B., "Does Sutton Apply to Supermarkets?" RAND Journal of Economics, 38(1): 43-59, 2007. 51 geographic markets. Between four and six firms capture the majority of sales regardless of market size. Endogenous sunk costs in distribution infrastructure create a concentration floor. Expanded in Ellickson, "Supermarkets as a Natural Oligopoly," Economic Inquiry, 51(2): 1142-1154, 2013. Quality investment by rival firms behaves as a strategic complement. ↩ ↩ ↩
- Norwegian Competition Authority, 2024-2025. NorgesGruppen, Coop Norge, and Reitan Group fined a combined NOK 4.9 billion (~$450M USD) for illegal information sharing on pricing. Combined market share: 96.6%. ↩
- Aalto-Setala, V., "The effect of concentration and market power on food prices: Evidence from Finland," Journal of Retailing, 78(3): 207-216, 2002. Larger grocery retailers carry higher markups. No firm-level scale economies found. Finland top three (S-Group, K-Group, Lidl): approximately 88% combined share. ↩
- Competition Bureau court documents, released January 2018. Canadian Grocer, February 1, 2018. The "7/10 convention": 7-cent wholesale, 10-cent retail, approximately twice per year. Products: bread, bagels, English muffins, naan, tortillas. Period: approximately 2001-2015. Companies named: George Weston Ltd., Loblaw, Canada Bread, Sobeys, Metro, Walmart Canada, Giant Tiger. The Bureau's June 2023 release also lists Maple Leaf Foods, Canada Bread's former parent, among the companies still under investigation. ↩ ↩
- Canada Bread guilty plea and $50 million fine: Competition Bureau Canada, June 21, 2023. The Bureau: "The fine is the highest price-fixing fine imposed by a Canadian court to date." Loblaw/George Weston $500 million settlement: CBC, July 25, 2024. Of the $500 million, $404 million is new money and $96 million is credit for the 2018 gift card program. Approved by the Ontario Superior Court, May 7, 2025, and the Superior Court of Quebec, July 2025. Loblaw and George Weston received immunity from criminal prosecution. Over 1 million Canadians submitted claims before the December 12, 2025 deadline. Investigation into remaining companies ongoing. ↩ ↩
- Loblaw $25 gift card program: announced December 19, 2017, distributed January 2018. Approximately 3.84 million Canadians registered. Total cost approximately $96 million. Cards redeemable only at Loblaw-operated stores. Charlebois, S., Dalhousie University Agri-Food Analytics Lab, estimated consumer overpayment of $4.3-4.9 billion, July 2024 (Toronto Sun). Class action plaintiffs alleged approximately $5 billion in damages. ↩
- Loblaw Companies Q1 2020 results, April 29, 2020. Revenue: $11.8 billion, up 10.7% ($1.14 billion increase). Net earnings: $240 million, up 21.2%. Approximately $751 million of the revenue increase attributed to COVID-related demand. ↩
- CBC, June 12, 2020. Loblaw: announced June 11, effective June 13. Metro: confirmed June 12. Sobeys: confirmed June 12. All three ended the $2/hour premium on June 13, 2020. Premiums announced March 21 to 22, 2020, retroactive to March 8. Loblaw's was a 15 percent raise, about $2 an hour at minimum wage; Metro's was $2 an hour; Sobeys paid $50 a week plus $2 an hour past twenty hours. ↩
- Cape Breton Spectator, June 29, 2022: Sarah Davis sent a "courtesy email" to competitors; Eric La Fleche called competing executives. Financial Post corroborated pre-cancellation contact. Competition Act amendments (Bill C-19) received Royal Assent June 23, 2022, criminalizing wage-fixing and no-poach agreements effective June 2023. ↩ ↩
- Byrne, D.P., and de Roos, N., "Learning to Coordinate: A Study in Retail Gasoline," American Economic Review, 109(2): 591-619, 2019. Perth, Western Australia. Fifteen years of daily station-level prices. Dominant firm (BP) used price experiments to signal collusive intentions. Tacit coordination improved margins by 75%. No formal agreement. The 75 percent margin figure and the naming of BP are from the October 2016 working paper presented at the FTC; the published abstract describes "a gradual, three-year equilibrium transition" led by dominant firms. ↩
- Stanford, J., "Updated Industry-Wide Data on Food Retail Prices, Volumes & Profits," Centre for Future Work, presentation to House of Commons Standing Committee on Agriculture and Agri-Food, December 2023. Statistics Canada Table 33-10-0225-01. Net income: $1.8 billion/year average (2015-2019), nearly $6 billion (2022). Net margin: 1.25% average (2015-2019), above 3% since mid-2021. ↩ ↩
- Loblaw Companies Q2 2025 results (quarter ended June 14, 2025), retail segment gross profit percentage 32.0%, which includes Shoppers Drug Mart as well as food stores. Toronto Star, October 4, 2025, from company data: 32.02 per cent, "the highest for the company in the past five years." Full-year 2025 gross profit margin: 31.4%. ↩
- Costco Annual Reports, FY2024. Gross margin: 12-13%. Markup cap: 14-15% since 1983. Membership fee revenue $4.83 billion, roughly half of operating income of about $9.3 billion (FY2024). Dunnhumby Retailer Preference Index Canada: Costco ranked first in 2024 and 2025 (BusinessWire, December 10, 2025). ↩
- Aklilu, S., et al., "Farmers' share of the consumer food dollar in Canada: What input-output data from 1997-2021 show us," Canadian Journal of Agricultural Economics, 73(4): 397-421, 2025. Farm share: 19.4% (1997), 18.6% (2021). Eighty-one cents of every food dollar goes to post-farm gate sectors (100 minus 18.6). ↩
- National Farmers Union of Canada, submission to House of Commons Standing Committee on Agriculture and Agri-Food, 2023. Bread retail price up 50% over 30 years, farmgate wheat flat. Ground beef retail doubled since 1994, farmgate cull cow price up 40%. Agricultural Producers Association of Saskatchewan, "Farmers and Food Prices," 2024. ↩
- Pauwels, K., and Srinivasan, S., "Who Benefits from Store Brand Entry?" Marketing Science, 23(3): 364-390, 2004. Store brand entry yields two benefits for retailers: high margins on the store brand and higher margins on national brands (strengthened bargaining). Consumers do not obtain lower prices on all national brands. Private-label margins typically 25-35% higher than national brand margins: Mercator Advisory Group, 2019. ↩ ↩ ↩
- Statistics Canada, "Shrinking Products, Rising Prices," February 18, 2025. 29.6% of eligible CPI grocery items experienced shrinkflation, 2021-2023. 49.5% of instances in 2022. 77.6% name-brand products. Most affected: margarine, pasta mixes, cookies, mozzarella, breakfast cereals, cheddar cheese. ↩ ↩
- Competition Bureau Canada, "Canada Needs More Grocery Competition," June 27, 2023, on property controls; and property controls investigation and guidance, June 2025. Loblaw committed to eliminating existing restrictive covenants and not entering new ones. Commissioner Matthew Boswell: "a key milestone for competition in the Canadian grocery industry." Competition Act amendments targeting property controls effective December 15, 2024. Sobeys resisting removal: CBC Manitoba, March 12, 2026. Empire consent agreement registered with the Competition Tribunal: CP24, September 22, 2026. ↩ ↩
- CBC Nova Scotia, November 12, 2025: 5 of 18 Sobeys stores and 10 of 13 Atlantic Superstores in Halifax Regional Municipality had property-control documents. Dartmouth, NS: 20-year deed restriction filed 2011 after Sobeys closed 2009. Edmonton 60-year covenants, Port Elgin 3-km radius restriction, Toronto 2-km restriction: jacobfilipp.com covenants database, March 2026. ↩