The machine read ten years of resumes. It built models for specific job functions and locations. It rated every applicant on a five-star scale, the way customers rate a product. The company believed it had automated the identification of talent.
By 2015 the engineers noticed a pattern. The machine was penalizing any resume that contained the word "women's." Women's chess club captain. Graduate of a women's college. The machine had learned what the company's workforce looked like, and it was filtering for resemblance, not ability.1
The company tried to fix it. They edited the code to neutralize the specific terms the machine had flagged. They could not be confident they had found all of them. The project was shut down. The team was disbanded. Reuters reported the details in October 2018.2
The machine had done exactly what it was designed to do. It found a pattern in historical data and used it to sort people. The pattern it found was not talent. It was the conditions under which the company had previously hired: who applied, who was referred, who got through the existing process, who already worked there. The machine photographed a set of conditions and presented the photograph as a measurement of ability.
The hiring algorithm is the newest version of something older. Every system that sorts people by a score treats the score as a fact about who they are. There is an older version, with better data and a longer record. It ran for a century before anyone checked what it was measuring.
The test
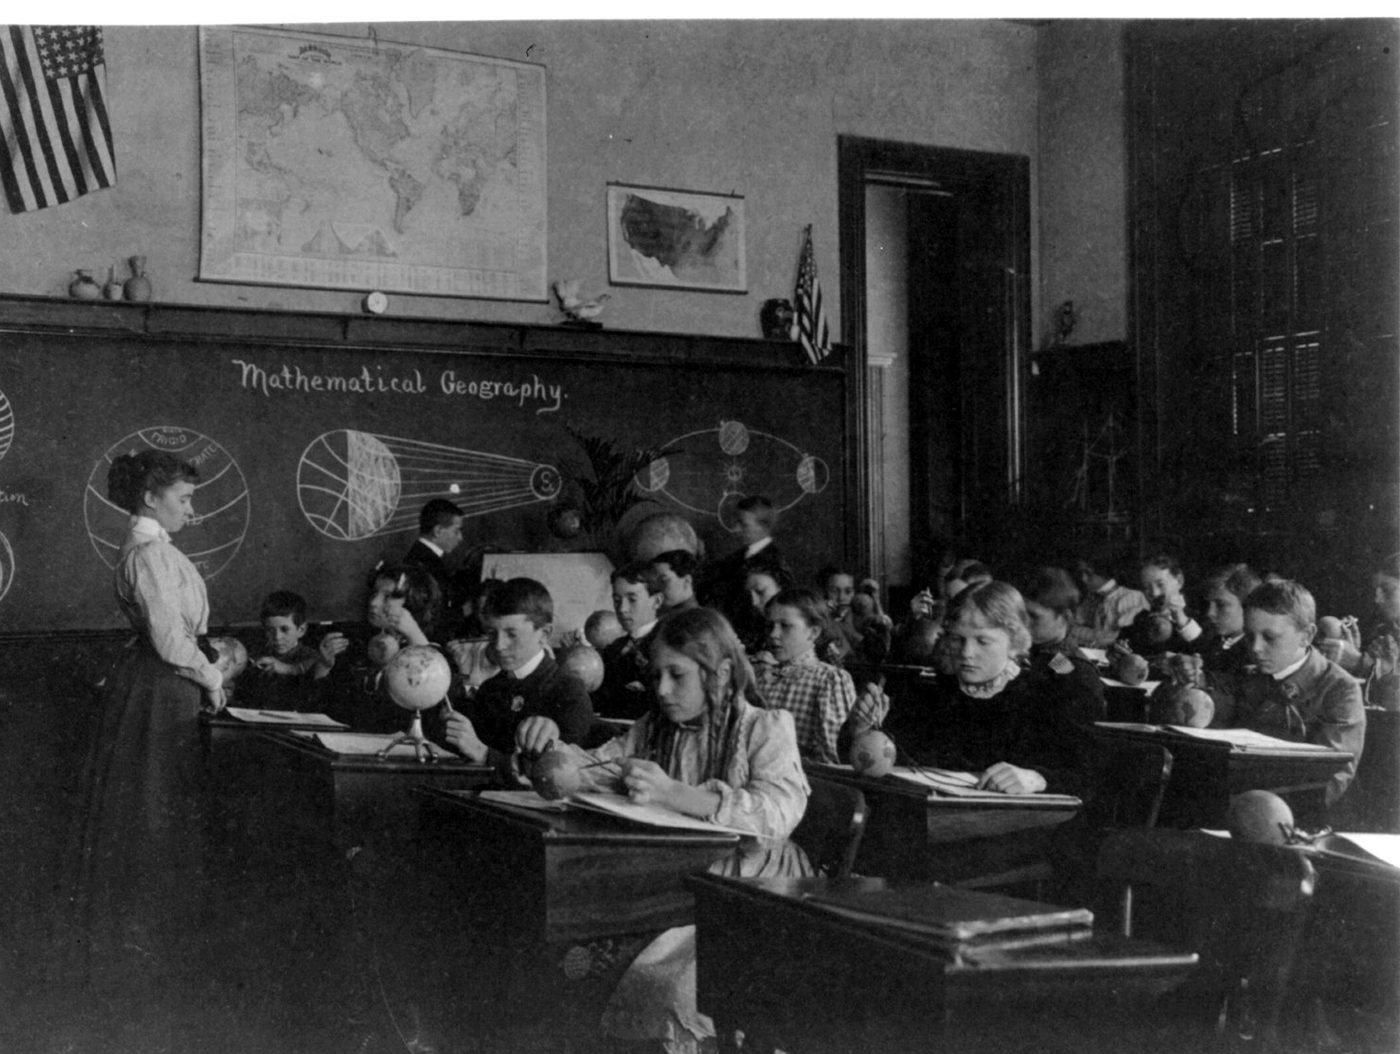
During the First World War, the United States Army administered mental tests to more than 100,000 soldiers. The results were broken down by ancestry. The proportions of soldiers who exceeded the American national norms looked like this:3
| Ancestry | Exceeding national norms |
|---|---|
| English | 67% |
| German | 49% |
| Irish | 26% |
| Russian | 19% |
| Italian | 14% |
| Polish | 12% |
Men from Italy, Poland, and Russia scored consistently at or near the bottom among immigrants from Europe. American blacks scored at the bottom among soldiers as a whole, though only marginally lower than these Southern and Eastern European immigrants.4
Black children attending schools in Youngstown, Ohio scored marginally higher on IQ tests than the children of Polish, Greek, and other immigrants. In Massachusetts, a larger proportion of black school children scored over 120 on IQ tests than did their schoolmates who were children of Polish, Italian, or Portuguese immigrants.5
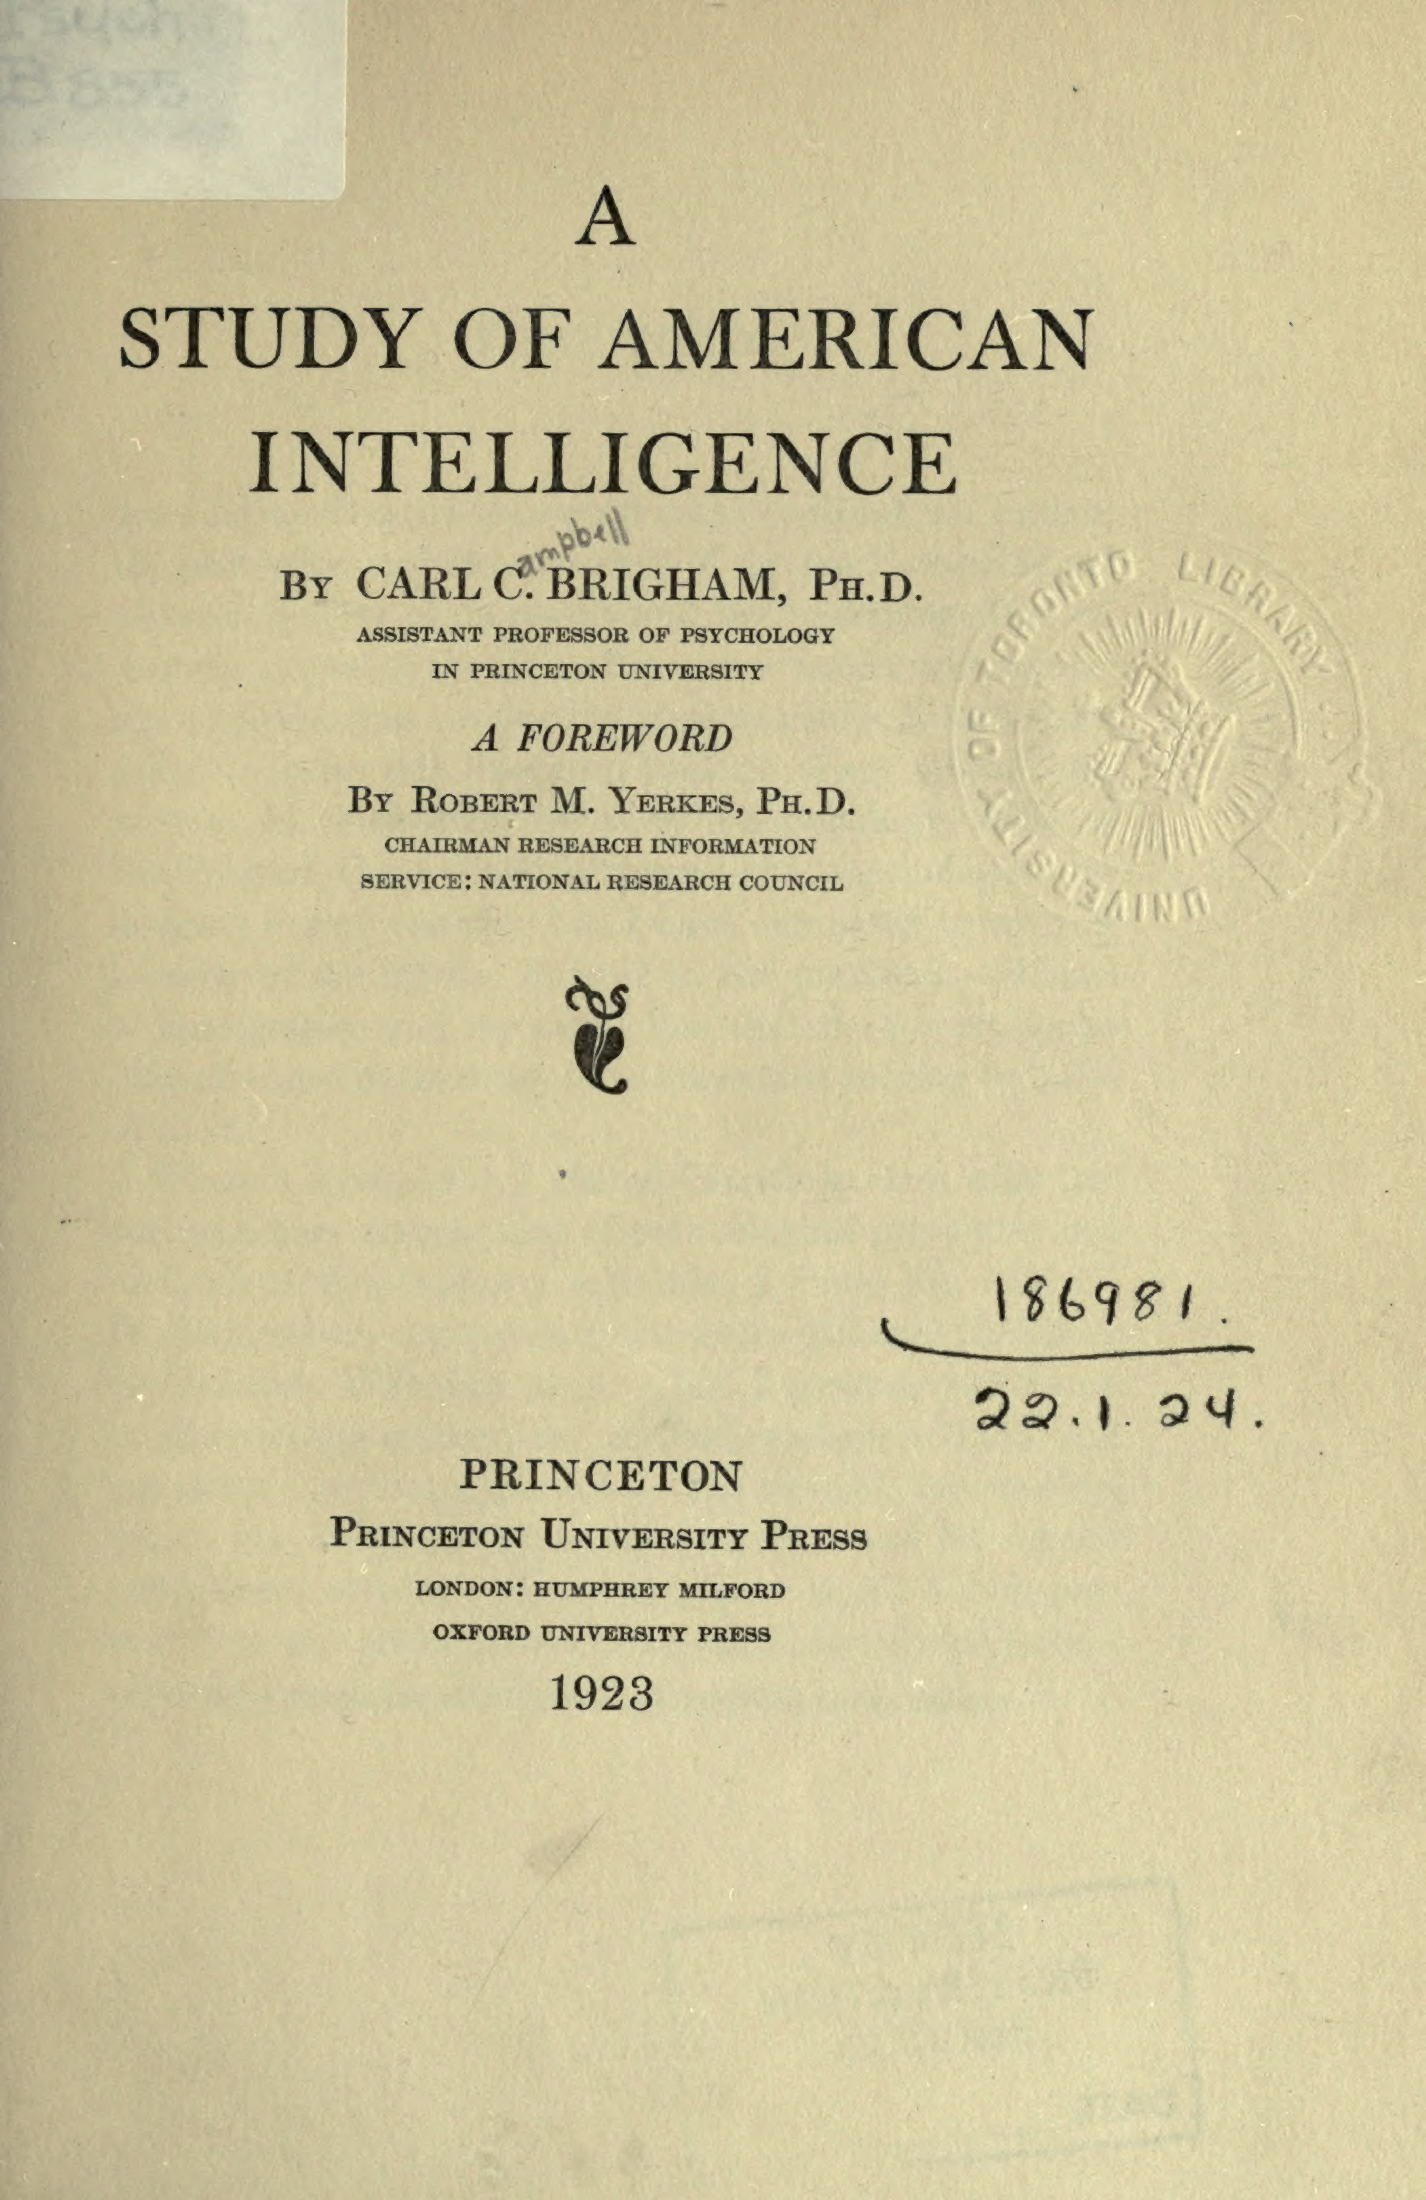
Carl Brigham, a Princeton psychologist and one of the foremost authorities on mental testing, examined the Army data and concluded that the results tended to "disprove the popular belief that the Jew is highly intelligent." Leading experts across the field reached the same conclusion. They classified entire immigrant populations as feebleminded. They recommended sterilization. They were not fringe voices. They sat on the advisory councils of eugenics societies, held professorships at Princeton and Stanford, and published in the most respected journals of the era.6
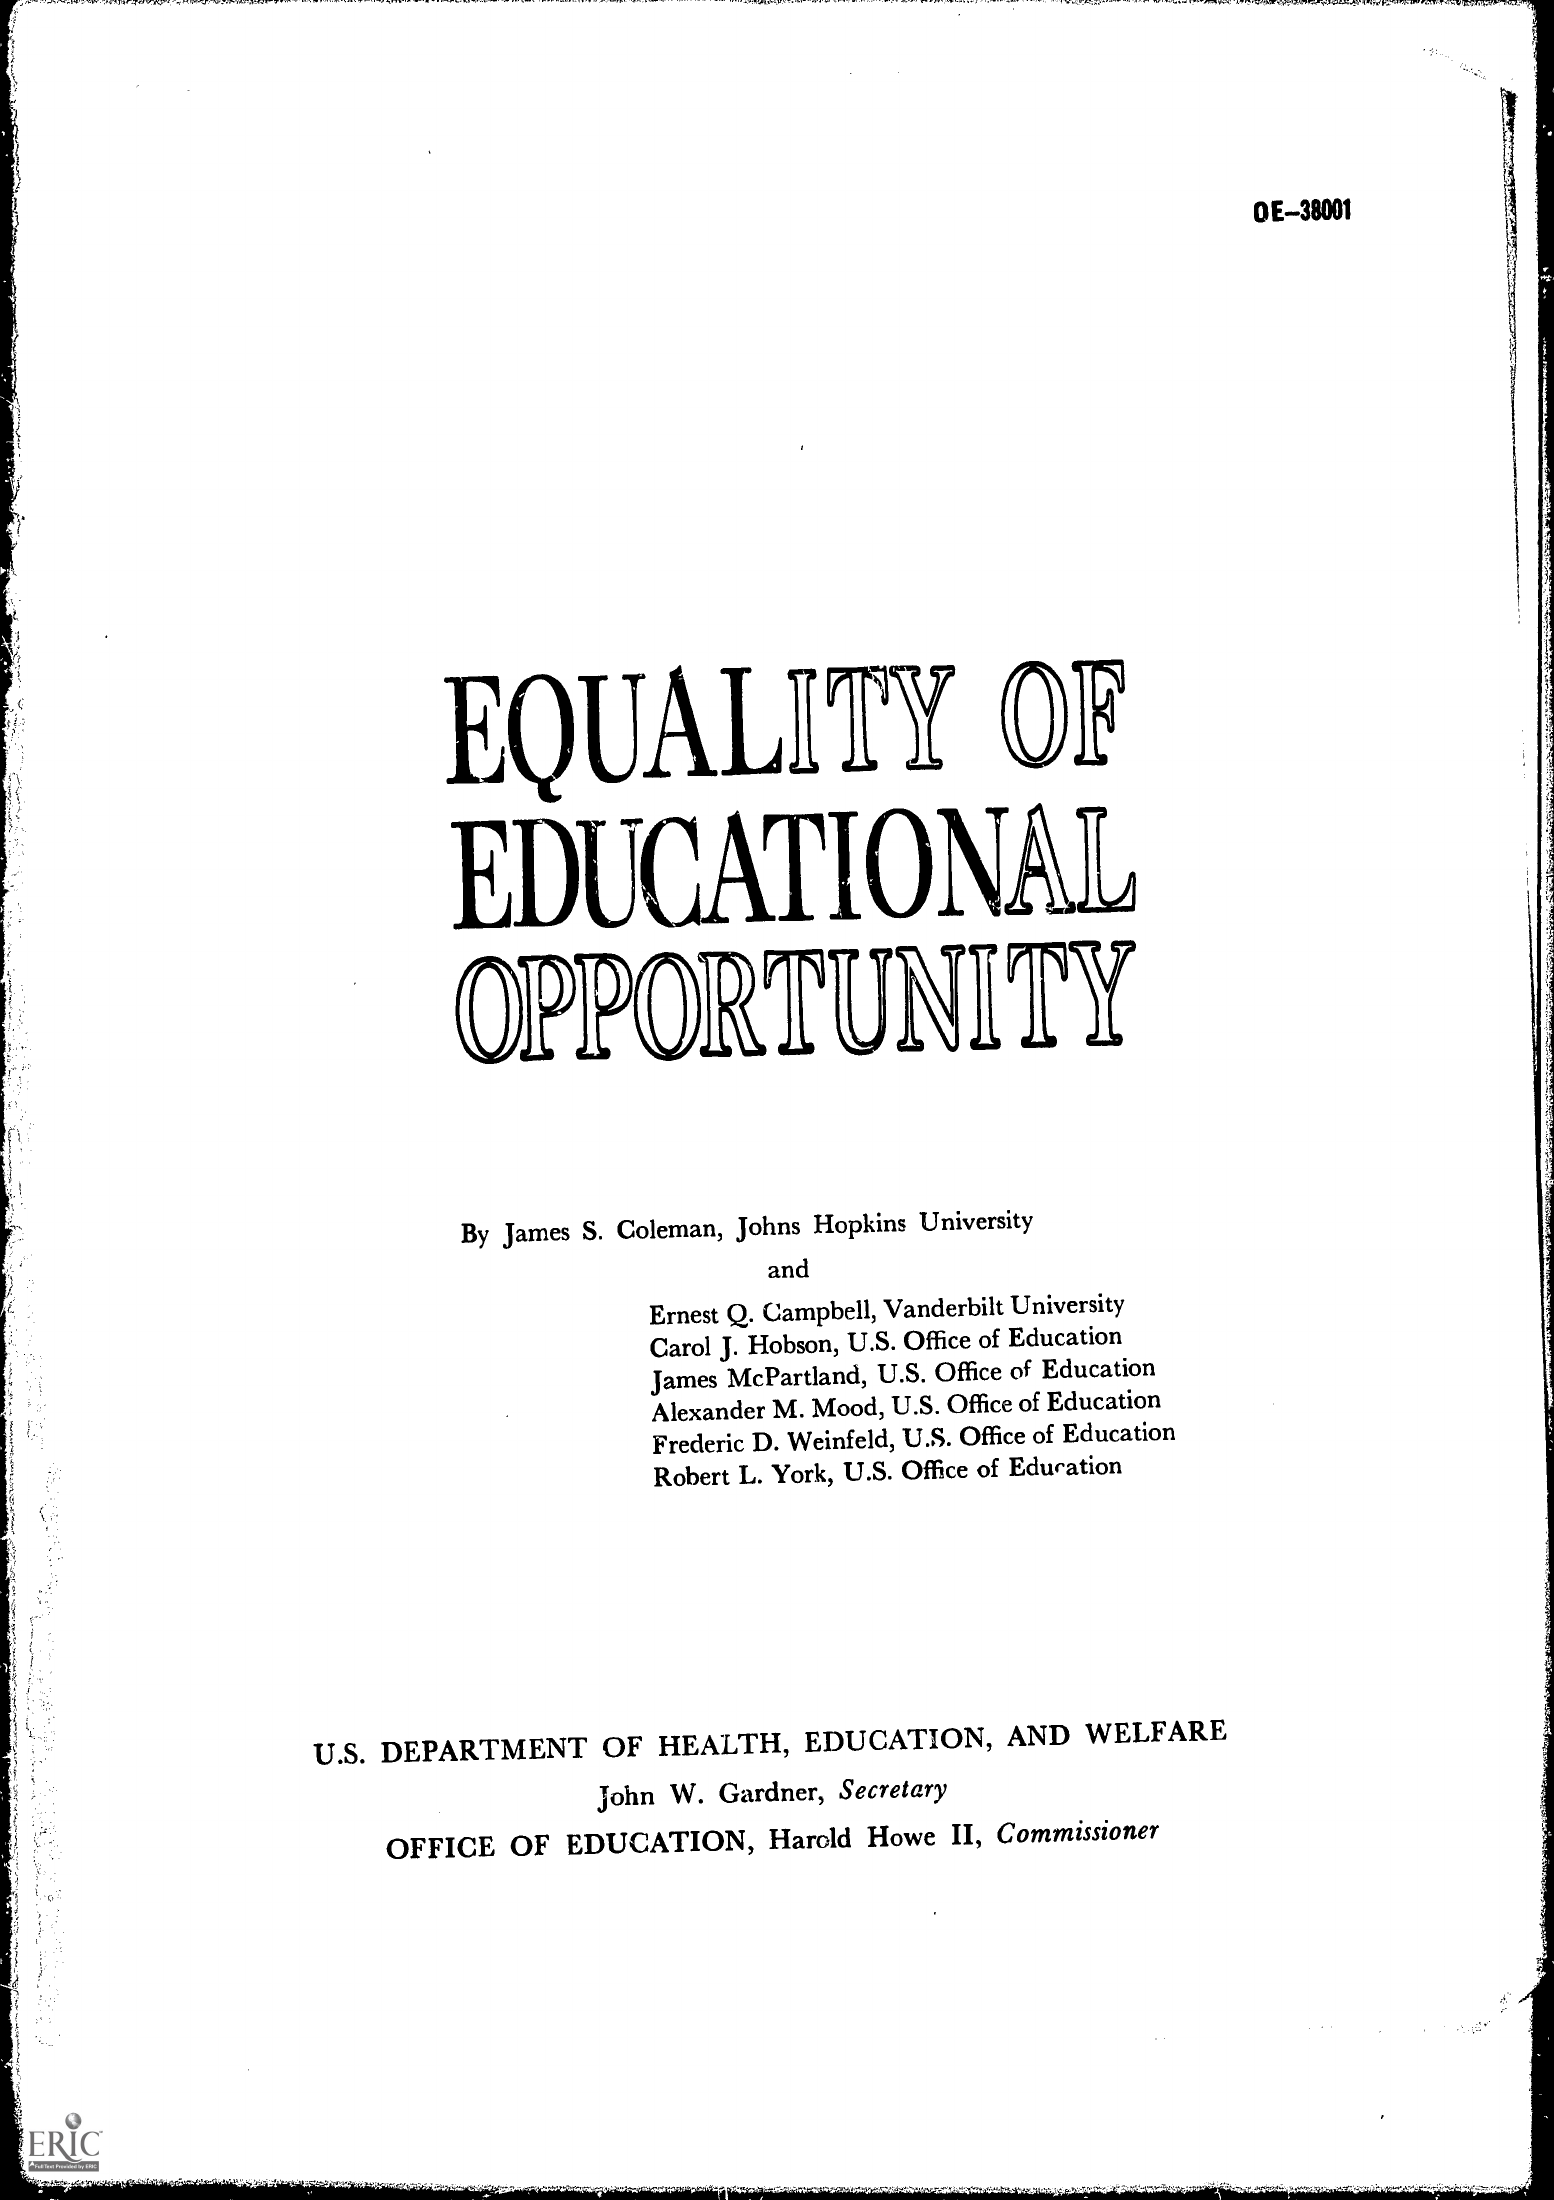
The scores drove policy. Brigham's book was frequently cited in Congressional testimony on immigration. The Johnson-Reed Immigration Act of 1924 used a quota system whose formula originated in a report from the Eugenics Committee of the United States Committee on Selective Immigration.7
The restrictions stood for forty-one years.
Without foundation
In 1926, three years after publishing a book that ranked races by intelligence, Carl Brigham designed the first Scholastic Aptitude Test for the College Board. On June 23 of that year, 8,040 American high school students sat for it. The same man, working from the same theory of racial intelligence.8
In 1930, Brigham published an eight-page paper in The Psychological Review. He acknowledged that the immigrant soldiers had been tested in English when their home languages were not English. He admitted that his conclusions about group differences could not be sustained by the tests he had used. He wrote that "one of the most pretentious of these comparative racial studies" was "without foundation." He was referring to his own.9
Terman never publicly recanted.10
The Immigration Act, built on findings its principal author called baseless, was not repealed until 1965.
The SAT still exists.
The photograph
The IQ scores did not remain where the experts left them.
Jews, whose test results were used to "disprove" their intelligence, had IQs above the national average by the 1920s. Italians, Greeks, Poles, Portuguese, and Slovaks, whose scores around the First World War were virtually identical to those found among blacks and Hispanics, rose to the national average or above in the postwar era.11
The Polish data is the sharpest.
1920s
1970s
A twenty-four-point increase in two generations.12
When Sowell wrote in 1981, the gap between black and white Americans on IQ tests was fifteen points.
The swing that already happened, in one group, is larger than the gap that remains in another.
The gene pool did not change. The conditions did. Economic mobility. Educational access. Cultural integration. English fluency in the home. The circumstances that the test captured shifted underneath the number, and when they shifted, the number moved with them. Group after group that was measured at the wrong moment and assessed as inferior later moved the score.13
Georgia, 1917
In the same Army tests, a fact was recorded that received almost no attention.
Georgia, Arkansas,
Kentucky, Mississippi Scored lower
Ohio, Illinois,
New York, Pennsylvania Scored higher
Same test. Same war. Geography predicted score better than race.14
James R. Flynn, a political scientist at the University of Otago in New Zealand, later discovered what the tests had been hiding worldwide. In more than a dozen countries, average performance on IQ tests had risen by one standard deviation or more in a generation or two. Dutch military conscripts gained twenty points in thirty years. The rise was concealed by the practice of renorming IQ tests to keep the average at 100.15

Why our IQ levels are higher than our grandparents' | James Flynn
TED
The apparent permanence of the black IQ at 85 is an artifact of that renorming.
The average number of questions answered correctly on IQ tests by black Americans in 2002 would have given them an IQ of 104 by the norms used in 1947. They now outperform what the average American scored in the late 1940s. The gap was closing. The renorming hid the closure. The measurement was redesigned to keep the number stable while the underlying reality changed.16
Between 1972 and 2002, black Americans gained four to seven IQ points on non-Hispanic whites. Gains were uniform across the entire range of ability.17
Even Arthur Jensen, the researcher most associated with hereditary theories of intelligence, found something in his own clinic that undermined his position. When he brought children from impoverished backgrounds into a "play therapy" room for a few days before retesting them, their IQ scores jumped eight to ten points. It rarely failed. More than half the fifteen-point gap, from a change of immediate circumstances. Jensen himself wrote that the full range of human talents is represented in all races and all socioeconomic levels, and that it is unjust to allow the fact of a person's racial or social background to affect the treatment accorded to them.18
A 1961 study examined the offspring of black and white American soldiers who fathered children with German women during the postwar occupation. The children grew up in Germany. There was no IQ difference between the two groups. They grew up in a nation without a black subculture. Different fathers. Same conditions. Same result.19
The IQ test was a photograph. It captured what was in front of the lens at the moment the shutter opened. The experts examined the photograph and concluded they were looking at the person. They were looking at the light.
The modern shutter
The IQ test was the twentieth century's sorting mechanism. It produced a score. The score determined who got in and who did not. Immigration. Education. Military placement. Employment screening. Each institution treated the score as a measurement of the person.
The IQ test was eventually retired as a policy tool. The error was not. It was upgraded.
Three digits
In 1989, Fair Isaac Corporation introduced the FICO score. As of 2026, FICO says its scores are used by 90 percent of top U.S. lenders. It determines who gets a mortgage, what interest rate they pay, whether they can rent an apartment, and the credit report behind it sometimes decides whether they get hired.20
The score captures payment history, debt levels, credit history length, credit mix, and new credit applications. It does not record what produced the pattern. Whether the missed payment was a choice or a medical bankruptcy. Whether the short credit history reflects irresponsibility or youth. Whether the person grew up in a household where credit was available or one where it was not.
The Federal Reserve Bank of New York data on median credit scores by income, 2020:21
Moderate-income: 692
Middle-income: 735
High-income: 774
116-point gap between low-income and high-income households
The score inherits. Opportunity Insights data shows that children of parents in the bottom income quintile average a credit score of 630. Children of parents in the top quintile average 740. The parents' conditions became the children's score.22
Zip code is never directly factored into a FICO score. But in thirty-eight of sixty major U.S. cities studied by the Urban Institute, the gap in median credit scores between predominantly white and nonwhite areas exceeds 100 points. The correlation between social capital indicators and credit data at the zip code level is nearly 0.8.23
In April 2023, the three major credit bureaus removed medical collections under $500 from all U.S. credit reports. They had already removed all paid medical collections the previous July. The changes cleared at least one medical collection from the reports of 22.8 million people. When a person's last medical collection came off, their score rose twenty-five points on average.24
No behavior changed. The conditions of measurement changed.
The Consumer Financial Protection Bureau's director said medical bills "have little predictive value in credit decisions." The bureau found that people with medical collections repaid other debts about as well as people whose scores were 10 points higher, and up to 22 points higher once the medical bill was paid. The score penalized a health event, not financial behavior. VantageScore's own analysis reached the same conclusion. Its chief executive said medical collections have "minimal impact on the predictiveness of creditworthiness for a large segment of the population."25
A medical bankruptcy eliminates access to competitive mortgage rates, most rental applications, and some employment. The person's knowledge of finance did not change. Their discipline did not change. Their character did not change. A health event happened to them. The score recorded the event as a verdict on the person.
The structure is identical to the one that sorted immigrants at Ellis Island a century earlier. A number was produced. The number was read as a fact about who the person was. The conditions that produced the number were not visible. The institution saw the score. It did not see what the score compressed into a single digit: the neighborhood, the school, the language spoken at home, the medical bill, the family wealth available to absorb a shock.
One hundred twenty names
In 2024, researchers at the University of Washington tested three widely used AI language models on resume screening. They used 554 real resumes submitted for nine different occupations, paired with 571 real job descriptions. They changed one thing on each resume: the name. Names carefully selected for their statistical association with race and gender.26
Same resume. Same qualifications. Same work history. Only the name changed.
White-associated names were preferred in 85.1 percent of cases. Black-associated names were preferred in 8.6 percent. When comparing white male names against black male names, the white names were preferred almost 100 percent of the time.27
Google analyzed its own hiring data and found GPA "worthless as a criteria for hiring."28 Children of the wealthiest 1 percent are thirteen times more likely to score 1300 or above on the SAT than children from low-income families.29 The man who designed the SAT called his own racial conclusions "without foundation." The test outlived the recantation by a century.
The Irish, again
Before the IQ test existed, the mechanism was already running.
"No Irish Need Apply." The phrase appeared in help-wanted ads from 1842 to 1909. Clerks, bartenders, farmworkers, house painters, hog butchers, coachmen, bookkeepers, bakers, tailors. In 2002, a historian published a paper arguing the signs were largely a myth. In 2015, a fourteen-year-old student at Sidwell Friends School in Washington found sixty-nine documented cases in the newspaper databases the historian had searched. She found court cases from 1853 and 1881 that the historian said did not exist. She published her rebuttal in the same journal.30
The Irish arrived in the 1840s and 1850s at the bottom of American society. Half of New York's Irish workforce and nearly two-thirds of Boston's were unskilled laborers or domestic servants. No other contemporary immigrant group was so concentrated at the lowest level of the economic ladder.31
In 1851, Boston hired its first Irish police officer. His name was Barney McGinniskin. Three years later, as the nativist Know Nothing movement gained power, he was fired. By the turn of the twentieth century, five out of six NYPD officers were Irish-born or of Irish descent. Economic research shows the children of famine immigrants had converged strongly on native outcomes by 1880, a single generation after arrival. In 1960, an Irish Catholic was elected president. In 2024, 32.4 million Americans claimed Irish descent. In 2023, their median household income was about 18 percent above the national median, and their poverty rate was less than half the national figure.32
The assessment was a photograph. The people were not in it.
One hundred twenty-two thousand
In February 1942, President Roosevelt signed an executive order giving the Army authority to evacuate any and all persons from the West Coast. Between March and November 1942, more than 100,000 Japanese Americans, two-thirds of them U.S. citizens, were shipped to internment camps in isolated, barren regions scattered from the California desert to the Arkansas swamps. By the war's end, about 120,000 had been held. Businesses built over a lifetime were liquidated in weeks. The government's own later estimate of losses, in 1983 dollars: $1.3 billion in property, $2.7 billion in lost income.33
By 1969, the average personal income of Japanese Americans was 11 percent above the national average. Family income was 32 percent above. In 2023, Japanese-American median household income exceeded $100,000, well above the national median.34
From mass internment and total asset liquidation to above-average income in twenty-seven years. The people did not change. The conditions around them did.
The counter-case
Individual cognitive differences are real. The test measures something at the individual level. A person with higher cognitive ability will, on average, perform better on tasks that require it. The research on this is robust, and this piece does not deny it.
It is treating group-level snapshots as permanent characteristics and building institutions on them. The individual test has predictive value for the individual. The group-level conclusion does not survive a conditions change. The Polish group scored 85. Individual Poles varied enormously within that average. The average moved twenty-four points when conditions changed. The individuals were always distributed across a range. The group average was a photograph of conditions, not a census of capacity.
The individual pilot's skill is real and testable. But if you tested pilots from only one training program and concluded that the population they came from could not fly, you would be measuring the program, not the people.
The score
The machine at the beginning of this piece did what every sorting system has always done. It found a pattern in historical conditions and presented the pattern as a measurement of the person.
The IQ test did it first. It ran for a century. It sorted immigrants, students, soldiers, employees. It drove national policy. It was used to restrict the entry of populations that were subsequently shown to be indistinguishable from or superior to the people who excluded them. The man who designed the test that still sorts American students into colleges called his own racial conclusions "without foundation." The conclusions were discarded. The test was not.
The credit score does it now. It compresses a person's circumstances into three digits and the institution reads the digits as character. When medical collections came off the reports of 22.8 million people, scores rose. For those whose last one went, the average jump was twenty-five points. The creditworthiness of 22.8 million people did not change overnight. The conditions of measurement changed. The score moved. It always moves when the conditions do.
The hiring algorithm does it next. It learns what previous employees looked like. It filters for resemblance. It calls the resemblance a prediction. When the University of Washington changed nothing but the name on a resume, white-associated names were preferred 85 percent of the time. The qualifications were identical. The name was the light. The algorithm was the shutter.
Nobody asked what the score was actually measuring. If the conditions change, does the score change? If the score changes, was it measuring the person or the conditions the person was in?
The Polish photograph was 85. It is now 109.
The Jewish photograph was "proven unintelligent." It is now above average.
The Italian, Greek, and Slovak photographs from 1917 are identical to photographs used today to sort different groups.
Every photograph changed when the light did.
Sources
- Jeffrey Dastin, "Amazon scraps secret AI recruiting tool that showed bias against women," Reuters, October 10, 2018. Amazon began building the tool in 2014. It built computer models to review job applicants' resumes with ratings from one to five stars. ↩
- Ibid. Amazon stated the tool was never used as the sole determinant of hiring decisions. The team was disbanded by early 2017. ↩
- Thomas Sowell, Intellectuals and Race (Basic Books, 2013), citing U.S. Army mental testing data from the First World War. Over 100,000 soldiers tested. ↩
- Ibid. Black soldiers scored at the bottom overall, though only marginally lower than Southern and Eastern European immigrants. ↩
- Sowell, Intellectuals and Race, citing civilian IQ testing data from Youngstown, Ohio schools and Massachusetts schools. ↩
- Carl Brigham, A Study of American Intelligence (Princeton University Press, 1923). Brigham was a Princeton psychologist and member of the American Eugenics Society's advisory council. On other leading experts of the era: H.H. Goddard administered mental tests to 178 immigrants at Ellis Island (1913-1917) and classified 83% of Jews, 80% of Hungarians, 79% of Italians, and 87% of Russians as "feebleminded." L.M. Terman, author of the Stanford-Binet IQ test, wrote in 1916: "Their dullness seems to be racial, or at least inherent in the family stocks from which they came." Madison Grant, a Progressive activist educated at Yale and Columbia Law, published The Passing of the Great Race (1916), which Hitler called his "Bible." See also Jonathan Spiro, Defending the Master Race (University Press of New England, 2009). ↩
- On Harry Laughlin as "Expert Eugenics Agent" to the House Committee on Immigration and Naturalization (1920-1924) and the Eugenics Committee's role in the quota formula, see Frances Janet Hassencahl, "Harry H. Laughlin, 'Expert Eugenics Agent'" (Case Western Reserve University, PhD dissertation, 1970). ↩
- On June 23, 1926, 8,040 American high school students took the first SAT, designed by Brigham for the College Board. See Nicholas Lemann, The Big Test: The Secret History of the American Meritocracy (Farrar, Straus and Giroux, 1999). ↩
- Carl Brigham, "Intelligence Tests of Immigrant Groups," The Psychological Review, Vol. 37 (1930), pp. 158-165. "Without foundation" is Brigham's own phrase applied to his own work. ↩
- Terman distanced himself from eugenics but never publicly recanted his racial claims. ↩
- Thomas Sowell, Ethnic America: A History (Basic Books, 1981). On Jews reaching above-average IQ by the 1920s, Italian and Polish IQs reaching or passing the national average in the postwar era. ↩
- "Polish IQs, which averaged eighty-five in the earlier studies, the same as that of blacks today, had risen to 109 by the 1970s. This twenty-four-point increase in two generations is greater than the current black-white difference (fifteen points)." Sowell, Ethnic America (1981). ↩
- Ibid. IQ scores for Italians, Greeks, Poles, Portuguese, and Slovaks around the First World War were "virtually identical to those found today among blacks, Hispanics, and other disadvantaged groups." ↩
- Sowell, Intellectuals and Race. White soldiers from Georgia, Arkansas, Kentucky, and Mississippi scoring lower than black soldiers from Ohio, Illinois, New York, and Pennsylvania on the same Army mental tests. ↩
- James R. Flynn, What Is Intelligence? Beyond the Flynn Effect (Cambridge University Press, 2007). On Dutch military conscripts: 20-point gain in 30 years (1952-1982). See also Wicherts et al., Netherlands Journal of Psychology, 2008. On the Flynn effect globally: approximately 3 IQ points per decade. See also Bratsberg and Rogeberg, "Flynn effect and its reversal are both environmentally caused," Proceedings of the National Academy of Sciences, 2018. ↩
- Sowell, Intellectuals and Race. "The average number of questions answered correctly on IQ tests by blacks in 2002 would have given them an average IQ of 104 by the norms used in 1947-1948." ↩
- William T. Dickens and James R. Flynn, "Black Americans Reduce the Racial IQ Gap: Evidence from Standardization Samples," Psychological Science, 2006. Analysis of 30 years of data from four intelligence tests, nine standardization samples, 1972-2002. ↩
- Arthur R. Jensen, quoted in Sowell, Intellectuals and Race. Jensen's clinical observation that IQ scores rose 8-10 points from a simple change of immediate circumstances. Jensen's statement on the full range of human talents appearing in all races and socioeconomic levels. ↩
- Klaus Eyferth, "Leistungen verschiedener Gruppen von Besatzungskindern im Hamburg-Wechsler Intelligenztest für Kinder (HAWIK)," Archiv für die gesamte Psychologie, Vol. 113, 1961. Children of white fathers averaged about 97 and children of black fathers 96.5. Flynn's reading, that the children "grew up in a nation with no black subculture," is quoted in Sowell, Intellectuals and Race, chapter 5. ↩
- FICO was introduced by Fair Isaac Corporation in 1989. FICO states its scores "are used by 90% of the top US lending institutions." FICO product page. ↩
- FRBNY Consumer Credit Panel/Equifax, 2020 Q2. Income groups follow the CFPB definition (area median family income: low under 50 percent, moderate 50 to 80, middle 80 to 120, upper 120 or more). ↩
- Trevor Bakker, Stefanie DeLuca, Eric English, James Fogel, Nathaniel Hendren and Daniel Herbst, "Credit Access in the United States," NBER Working Paper 34053, July 2025 (Opportunity Insights). Ages 35 to 42: average scores of 630 for children of bottom-quintile parents and 740 for top-quintile parents. ↩
- Urban Institute analysis of 60 major U.S. cities. On the 0.8 correlation between social capital indicators and credit data at the zip code level, see "Your Friends, Your Credit: Social Capital Measures," Federal Reserve FEDS paper 2023-048. ↩
- Paid medical collections removed July 1, 2022; collections under $500 removed, announced April 11, 2023. CFPB, "Consumer Credit and the Removal of Medical Collections from Credit Reports," April 26, 2023: the changes "removed at least one medical collection from the credit reports of 22.8 million people" and all medical collections for about 15.6 million. People "experience a 25-point increase in their credit score, on average," in the first quarter after their last medical collection is removed (2012 to 2020 data). ↩
- CFPB Director Rohit Chopra, CFPB press release, September 21, 2023: "Research shows that medical bills have little predictive value in credit decisions." CFPB, "Data Point: Medical Debt and Credit Scores," May 2014: scores may underestimate creditworthiness by about 10 points for consumers with medical debt and by up to 22 points after it is paid. VantageScore, August 2022: medical collections "have minimal impact on the predictiveness of creditworthiness for a large segment of the population." ↩
- University of Washington, "AI tools show biases in ranking job applicants' names," October 31, 2024. 554 real resumes, 571 job descriptions, 9 occupations, 120 names. Kyra Wilson and Aylin Caliskan, presented at the AAAI/ACM Conference on AI, Ethics, and Society, 2024. ↩
- Ibid. White-associated names preferred in 85.1% of cases. Black-associated names preferred in 8.6%. ↩
- Laszlo Bock, Senior Vice President of People Operations, Google, interview with The New York Times, 2013. ↩
- Raj Chetty, John Friedman, and David Deming, "Diversifying Society's Leaders?" Opportunity Insights/NBER Working Paper 31492, 2023. ↩
- On "No Irish Need Apply": Rebecca Fried, "No Irish Need Deny," Journal of Social History, Vol. 49, No. 4, 2016, pp. 829-854. Response to Richard Jensen, "'No Irish Need Apply': A Myth of Victimization," Journal of Social History, Vol. 36, No. 2, 2002. Fried was a 14-year-old student at Sidwell Friends School. She found 69 documented cases and court cases Jensen said did not exist. ↩
- Manhattan Institute, "Lessons From the Rise of America's Irish." NBER Working Paper No. 25287: "The Economic Assimilation of Irish Famine Migrants to the United States." ↩
- On NYPD: by 1900, five of six officers were Irish-born or of Irish descent. Economic convergence in one generation: NBER/CEPR research (Zimran). Ancestry count: U.S. Census Bureau, Irish-American Heritage Month Facts for Features, February 17, 2026 (2024 ACS: "32.4 million or 9.5%"). Income and poverty: 2023 American Community Survey selected population profile, Irish ancestry. ↩
- Executive Order 9066, February 19, 1942. About 120,000 people held over the course of the war; more than 100,000 removed between March and November 1942 (Sowell, Ethnic America), two-thirds U.S. citizens. Government estimate (Commission on Wartime Relocation and Internment of Civilians, 1983 dollars): $1.3 billion property, $2.7 billion income. See Sowell, Ethnic America, Chapter 7; National Archives, "Personal Justice Denied," Chapter 4. ↩
- Sowell, Ethnic America. By 1969, Japanese-American personal income was 11% above national average, family income 32% above. 2023 data: Japanese-American median household income $100,611 (American Community Survey). The 2023 national median was $77,719 in the same survey and $80,610 in the Current Population Survey. ↩